
I’ve spent my career managing multi-billion-dollar fixed income, currency and commodity portfolios for some of the best teams in the world. The most important lesson I took from decades of experience is that getting the long-term trend right matters far more than anything the market does on a given day. Getting the trend right means knowing where the economy is headed, and understanding that gets down to two things: jobs and productivity.
The reason is simple. An economy builds wealth primarily in two ways: more people go to work, and each hour of work produces more than it used to. Credit creation is also an important factor, but we’ll set it aside for now. Everything else is noise, timing, or a downstream effect of those two forces.
That isn’t where most of our attention goes. We obsess over quarterly GDP prints, the monthly CPI number, the Fed’s next move and whether the S&P set another record. Those numbers matter if you’re trading this week. They tell you surprisingly little about whether a country is building wealth for its citizens.
Boiling it down, if you want to know whether an economy is healthy, start with productivity and read it alongside job growth. Together they tell you whether growth is real, whether ordinary people share in it, and whether it can last. And right now we’re at the front edge of what could be the biggest productivity shock the world has seen in decades: artificial intelligence.
Lately a lot has been made of the not-in-my-backyard fights over data centers and a long list of possible downsides to AI. Here’s the reality: someone is going to build this. If not us, then we know China will. Setting global competition and politics aside, choosing the less productive path won’t raise anyone’s standard of living. It will only lead to economic malaise, an economy that never reaches its potential, and stagnation in the factors that improve people’s wealth and quality of life.
A lesson from the past: bread, wages and the tractor
For most of human history, there was no real concept of wealth outside the aristocracy. For everyone else, work meant survival. Adam Smith, the father of modern economics, saw it differently. A nation’s wealth, he argued, comes from how productive its labor is, not how much gold it holds. And the best long-run measure of that labor wasn’t gold or silver. It was grain.
Economic historians turned that idea into a measuring stick for how well ordinary people lived in agrarian times. They called it the wheat-to-wage ratio: how long it took to earn the wheat that became your bread. That connection lives on today, and it’s the genesis of why we colloquially refer to money as “bread” or “dough.” As the father of two young kids, I’m sure that sounds pretty boomer to them. But the lesson behind it still matters today.
To illustrate this point, picture a valley of 100 families, cut off from the world. Ninety of them farm by hand and with horses, and they grow just enough to feed everyone. A day’s work buys barely enough grain to feed a family. They aren’t lazy. They’re poor because an hour of work produces so little.
Then the tractor arrives, and 10 families can grow what 90 did. For the 80 families pushed off the land, it’s a disaster. For the 10 who mechanize, it’s the first time they’ve had discretionary income, money left over after eating, which they can now spend on houses, clothes, cars, doctors and school. Somebody has to provide all of those discretionary goods and services. The displaced families become the mechanics, carpenters, teachers and shopkeepers. A generation later the valley grows the same food but now has a main street too. This is the creative destruction of capitalism.
That’s the story of America. Henry Ford’s Fordson made tractors cheap starting in 1917. The knock-on wealth effect wasn’t linear, and there was a painful transition while people retrained, but over the next century farm work all but disappeared while food went from nearly half the household budget to less than 10% (see table below). The early winners earned so much discretionary income that much of it naturally recycled back into the broader economy, lifting all boats.
| Measure | Before mechanization | After mechanization |
|---|---|---|
| Share of US workforce in agriculture | 41% (1900) | 1.4% (2025) |
| Share of household spending on food | 42.5% (1901) | 9.7% of disposable income (2025) |
Sources: USDA ERS, BLS, BLS, USDA ERS.
Today an hour of average pay, $37.75, buys almost eight bushels of wheat at about $5 a bushel. We stopped measuring wealth in bread because bread got so cheap. That’s what productivity does. If the tractor hadn’t pushed most farmers off the land, we’d still be working the fields from sunup to sundown and spending nearly half our income on food.
But the valley only got rich because the people the tractor displaced found new work. AI is the next tractor, and this time it’s coming for office jobs, not farm jobs. If those workers land somewhere productive, AI’s gains become everyone’s gains. It’s early yet, but we may already be seeing this in new business formations, which are running near record highs: about 532,000 in August 2026 alone (Census Bureau).
US vs. Europe: a more recent example
If you want a more recent example of productivity’s impact, look no further than the wealth differential between the US and Europe since 2000. In the mid-1990s the US and Europe were two rich, well-educated democracies in roughly the same place. One kept growing its productivity. The other stopped. European productivity, which had reached 95% of the US level by 1995, has since slipped below 80% (Draghi report), resulting in EU GDP per person slipping to 52% of the US level in dollar terms (World Bank). The gap in living standards followed almost exactly.
You could clearly see this differential in, of all places, Taylor Swift’s Eras Tour in 2024. Resale tickets for her US shows in Miami, New Orleans and Indianapolis ran $2,000 to $8,500, while seats in Portugal, Spain and Germany went for around $300 to $400 (Fortune). So many Americans flew to Europe to see her that it made headlines. Part of that gap came from a strong dollar and European caps on resale markups, but it also reflects a simpler fact: American consumers have more discretionary income, thanks to a higher standard of living built on higher productivity.
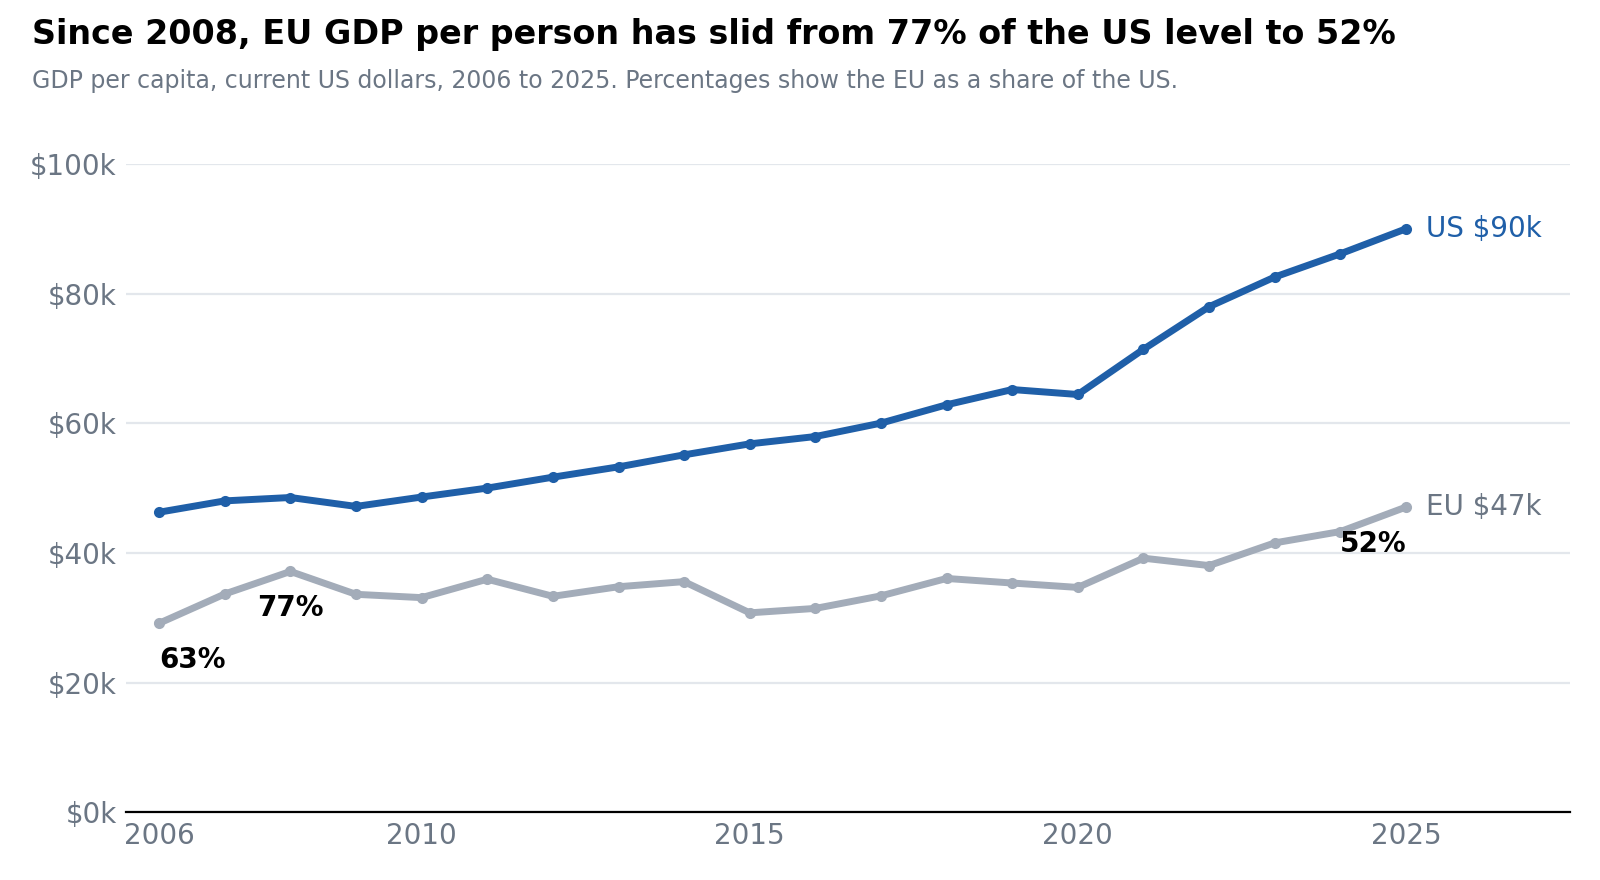
Source: World Bank, GDP per capita (current US$), EU and US, 2006 to 2025.
| Measure | Euro area / EU | United States | Source |
|---|---|---|---|
| Productivity per hour, 1995–2019 (cumulative) | +28% (about 1% a year) | +50% (about 2.1% a year) | ECB |
| Productivity per hour, Q4 2019 to Q2 2024 | +0.9% | +6.7% | ECB |
| Info and communications productivity, Q4 2019 to Q1 2024 | +6.5% | +27.2% | ECB |
| Real disposable income per person since 2000 | Grew about half as fast as the US | Grew almost twice as fast | Draghi report |
It’s tempting to say Americans simply work harder, and they do put in roughly 15% more hours than the EU average. But that isn’t the main story. The Draghi report found that around 70% of the gap in income per person comes down to lower productivity. In his words, “The main driver of these diverging developments has been productivity.”
And the productivity gap is mostly a technology gap. Draghi calls digital technology “the key driver.” Take the tech sector out, and Europe’s productivity growth from 2000 to 2019 was about the same as ours: 0.6% a year against 0.8%. Europe sat out the internet and cloud waves while the US built Microsoft, Google, Amazon and Apple, and every other American industry got more productive using their tools. Heavier regulation, fragmented capital markets and a focus on less productive energy sources like wind and solar all exacerbated this differential.
Europe, in other words, is the valley that put extra governors on its tractors. Its workers are just as skilled, and it has a generous social model. But without productivity growth, incomes stalled and their economies have fallen behind. After 2020 Europe also leaned on job-retention schemes that kept people employed but kept them in place, often in less productive roles. AI is the same test again, only bigger. Whichever economy adopts it fastest and moves its workers into new work will set living standards for the next generation.
AI is the next productivity engine
AI is the best shot in a generation at lifting US productivity growth off the plateau it’s been on since the mid-2000s. The money is already flowing. The payoff is starting to show up, but it isn’t proven yet.
Large tech companies were expected to spend at least $650 billion on AI in 2025, and Deutsche Bank thinks data center spending alone could reach $4 trillion by 2030 (Richmond Fed). A Federal Reserve note found that AI investment, mainly software and computer equipment, “contributed meaningfully” to GDP growth from 2025 into early 2026 (Federal Reserve).
There are early signs it’s working. Stanford economists estimate US productivity grew about 2.7% in 2025, close to double the 1.4% average of the prior decade, and business adoption of AI jumped from 55% in 2023 to 78% in 2024 (both via the Richmond Fed). Official numbers show nonfarm productivity up 2.2% over the year through the second quarter of 2026 (BLS).
Still, it’s early. The same Fed note points out that sectors with heavy and light AI exposure have shown similar productivity trends so far, which suggests gains inside individual firms aren’t yet adding up across the economy.
Anthropic recently published three scenarios for what AI could do to the US economy by 2030. In the modest case, AI looks like the internet: GDP ends up 1.6% above where it would otherwise be, at about $34.1 trillion, labor keeps about 59% of national income, and unemployment stays in its normal range. In the substantial case, AI handles half of all knowledge work. GDP is 8.3% higher, at $36.3 trillion, but knowledge workers’ wages go flat and labor’s share falls to about 56%. In the extreme case, AI outperforms people at most knowledge work. GDP is 32.4% higher, at $44.4 trillion, but unemployment climbs past recession levels and labor’s share drops to about 45%.
That spread is exactly why productivity and jobs have to be read together. The bigger the productivity gain, the bigger the risk that the rewards go to capital providers instead of workers. When Anthropic surveyed more than 10,000 Americans in August, the typical answer was close to the middle scenario: a big productivity dividend, with knowledge workers’ pay stuck while others gain. Whether that dividend reaches households depends on how quickly people move into new, productive work.
The bottom line
None of this is guaranteed. Displacement could outrun creation: two of Anthropic’s three scenarios shift income from workers to capital, and if knowledge workers’ wages stall faster than new work appears, most households won’t feel any richer. A lot of AI spending is borrowed, with big tech selling close to $90 billion in bonds in the fourth quarter of 2025 alone, so if returns disappoint, investment can reverse quickly. And the payoff may take time. Electricity and computers both took decades to show up in the national numbers.
But the US has the most important ingredient: a productivity engine in AI. Whether it turns into wealth for ordinary people depends on jobs moving with it. So I’d keep the watch list short: productivity growth above 2% for several years running, payrolls growing at least as fast as the labor force, real wages rising along with productivity, and labor’s share of income holding steady.
If all four come through, the next decade could look like the late 1990s, only bigger. If we get the productivity without the jobs, the country will get richer on paper while its politics get angrier. Of all the numbers on the screen, these are the two worth watching.
Sources
- BLS, Productivity and Costs, Q2 2026 Revised
- BLS, Employment Situation, August 2026
- BLS, 100 Years of U.S. Consumer Spending
- BLS, Employed people in agriculture and nonagricultural industries, 2025 annual averages
- USDA ERS, The 20th Century Transformation of U.S. Agriculture and Farm Policy
- USDA ERS, Share of disposable income spent on food
- USDA NASS, Agricultural Prices, September 2025
- U.S. Census Bureau, Business Formation Statistics, August 2026
- World Bank, GDP per capita (current US$), EU and US
- Mario Draghi, The Future of European Competitiveness (2024)
- ECB, Labour productivity growth in the euro area and the United States
- Economics Help, Europe’s Economic Decline
- Fortune, Taylor Swift’s Eras Tour is cheaper in Europe (May 2024)
- Allen et al., Wages, Prices, and Living Standards in China, Japan, and Europe, 1738–1925
- Wikipedia, Slang terms for money
- Anthropic, Economic Scenarios
- Federal Reserve, The AI Buildout and the Economy
- Richmond Fed, Will AI Investments Pay Off?